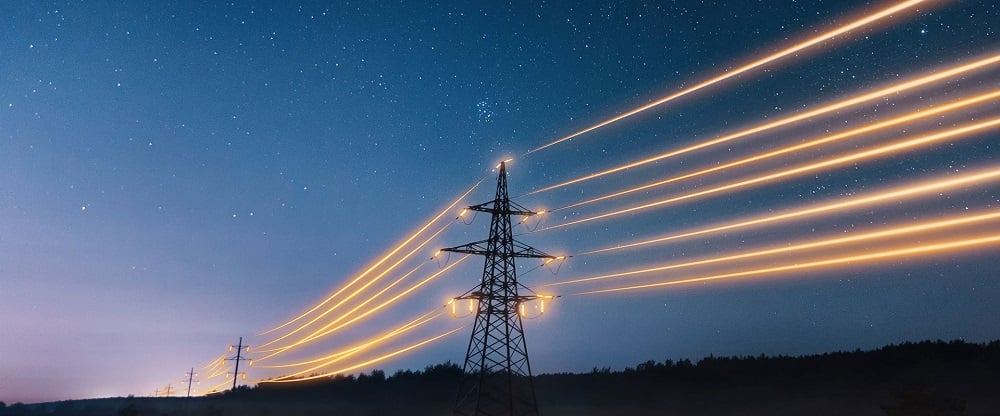
Australia's energy landscape
2023-06-15T15:32:00Z
Energy
Energy
From the toaster that pops out your morning slice of wholewheat, to the machines in the factories that produce those appliances, every day is powered by our demand for energy. Australia’s energy mix is made up of coal, oil & gas and renewables – but how is it distributed across each state, what are the governments’ plans for more sustainable resources and how does this impact future job prospects?
We break down Australia’s energy landscape below.

Queensland’s impressive thermal generation fleet generates about 80% of the state’s energy and contains four of the youngest and most efficient coal-fired generators in the National Electricity Market, which will play an important role during the state’s transitionary period towards cleaner energy generation.
The Sunshine State faces some core energy challenges, including rising prices of electricity and gas, system security, gas availability and energy and climate policies. These challenges are exacerbated by closures of ageing coal-fired generation and gas supply restrictions in southern states, lack of investor confidence and uncertain national policy.
In 2017, the Queensland government released its Powering Queensland Plan, which outlined Queensland's short and long-term energy challenges and offered strategies to deal with these challenges. The proposed renewable energy projects will result in $2.2b in investment, 2200 new construction jobs, and a carbon dioxide reduction of 2.8m tonnes.

Coal accounts for 41% of New South Wales’ energy mix, and coal-fired generation remains the preeminent source of energy generation in the state. The New South Wales government has developed long term strategies for the future of the state’s energy generation, including making the state’s electricity market more efficient and competitive by mitigating risk, reducing costs and government caused delays and encouraging investment in modern energy technology.
With a decline of 34%, New South Wales also experienced one of the largest drops in natural gas-fired generation from 2020-21, knocking Queensland off the top spot to become the nation's leader for large-scale solar generation and displaying their continuing commitment to transitioning to clean energy.

Most of Victoria’s electricity is generated by three main brown coal-fired thermal power stations.
The Victorian Government has also outlined their ambitious Renewable Energy Targets:
In 2022, Premier of Victoria Daniel Andrews announced the government's intention to update the Renewable Energy Targets from 50% to 65% by 2030, and 95% by 2035.
Historically, Victoria's energy generation heavily relied upon brown coal, but this reliance has significantly decreased after the closure of the Hazelwood Power Station in 2017 which accounted for around 20% of Victoria's electricity supply.
The Victorian Government is also supporting the development of microgrids, which are small electricity networks which can run on renewable energy. Microgrids can still be connected to larger energy grids, but can also work in isolation, relying on local energy such as batteries, wind turbines, and solar panels - making these facilities ideal for rural and isolated communities.

70% of South Australia's electricity is generated from renewable power sources, with the goal of 100% renewable power being set for 2030. South Australia also boasts the world's first power system that can exceed the state's energy demand through rooftop solar alone. However, technical and safety complications have arisen when integrating this modern power source with the state's other traditional power sources.
The South Australian Government is meeting this problem by modernising their energy system through a series of projects and strategies which will allow them to safely move forward with their energy goals.

Western Australia is predominantly powered by oil and gas, with lesser amounts from renewable sources such as wind, solar and landfill gas. Electricity in WA is supplied to homes and businesses via the South West Interconnected System (SWIS), which includes 7,750km of transmission lines and 93,350km of distribution lines. As well as being the world’s largest lithium producer, the state boasts large reserves in natural gas and minerals such as cobalt and nickel.
With its vast land mass and sophisticated energy infrastructure, WA is favourably positioned to become a world leader in the renewable space - particularly in the green hydrogen industry. Major investment is being poured into developing the infrastructure around the SWIS to meet the challenges and opportunities associated with integrating renewable energy sources.

A large proportion of the Northern Territory’s energy is powered by gas, with the state owning and operating eight gas powered stations. Interestingly, coal does not contribute to NT’s energy mix at all. However, the total proportion of renewable sources in the system amounts to less than 1%. The Northern Territory is in a great position to increase their renewable energy, especially in Darwin where there is an abundance of solar energy resources with ideal weather conditions. The local government has announced its plans to hit a target of 50% renewables by 2030, with the transition expected to boost local jobs within the sector as well.

Tasmania has long had one of the greenest energy supplies in Australia, with renewables making up 47.5% of their energy mix. When it comes to energy consumption, Tasmania can boast a low consumption rate when compared to other states, due to the limited gas reticulation systems available within the state, which prevents consumers from accessing a gas supply.
Instead, hydropower dominates Tasmanian electricity generation, supplying around 80% of total energy. Tasmania has focused its efforts into major renewable energy projects and is looking to double its renewables generation to a world leading target of 200% of its current needs by 2040.

Location: Wuppertal
hrs a week: 40 hrs a week
Closing: 30 June 2027
Location: Wuppertal
hrs a week: 40 hrs a week
Closing: 30 June 2027
Location: Wuppertal
hrs a week: 40 hrs a week
Closing: 30 June 2027
Location: Wuppertal
hrs a week: 40 hrs a week
Closing: 30 June 2027
Whether it’s planning, construction or ongoing maintenance of energy infrastructure, Brunel can provide the highly-skilled, niche and in-demand professionals needed to ensure your operations meet and exceed their production targets.